
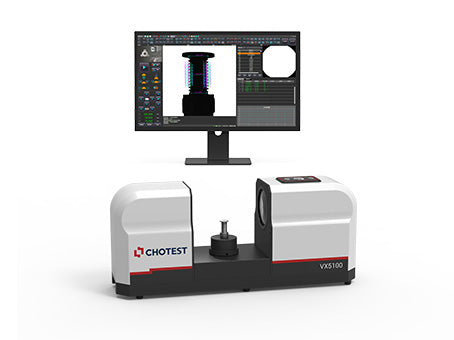


details
| Model | VX5100 | ||
| Image Senor | 5MP CMOS | ||
| Outside Monitor | 24" LCD (XGA:1920×1080) | ||
| Acceptance Lens | Double Telecentric Lens | ||
| Back Light | Telecentric transmission illumination | ||
| F.O.V. | ?100mm | ||
| Repeatability | ±2um | ||
| Accuracy *1 | ±5um | ||
| Software | VisionX | ||
| Resolution | 0.1um | ||
| XY Obejct Table(Optional) |
Retational Speed | 0.2 Revolution/s | |
| Diameter | ?60mm | ||
| Capacity | 3kg | ||
| Size(LxWxH) | 736×200×325mm | ||
| Weight | 25kg | ||
| Input | AC100~240V,50/60Hz,1.3A,150W | ||
| Working Environment | Temp.10 °C~35 °C, Humidity 20~80%, Vibration<0.002g, Less than 15Hz | ||
| Remark: *1 In the focus position, the environment temperature is +20 °C ± 1.0 °C |
|||
Features
Geometric Tolerance Straightness, Roundness, Concentricity, Symmetry, Positional Tolerance, Parallelism, Perpendicularity, Pro?le Tolerance, etc.
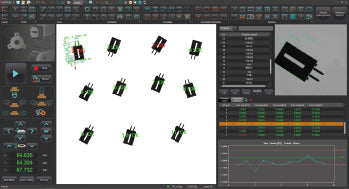
CNC Mode Modify CNC program anytime, as well as adding or reducing features, OK or NG is concluded according to tolearance in CNC program
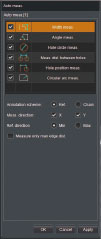
Automatic Only need to select the measuring features, after placing the workpiece, measuring results can be obtained quickly by one key
Coordinate System Can create coordinate system by Point-line, Line-line, and translate & rotate coordinate system, as well as create multi-coordinate system
Special tools Rounded corner, Contour, Thread, Slot, Perimeter, Pitch distance, Thickness, Chamfer, Spring, Gear, Sealing gasket, area, Pitch Angle, Boundary width

DXF Import
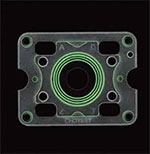
Measurement data can be obtained from CAD drawings. Even if the test object is not physically available, you can still create measurement programs quickly.The system can automatically assign features and dimensions from the DXF drawing to the sample, including surface dimensions
 Sample
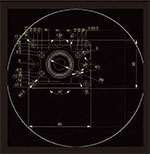 Automatically assign DXF features to the sample
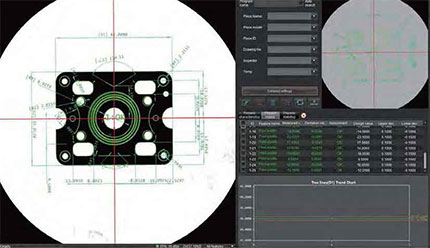 CNC Measure
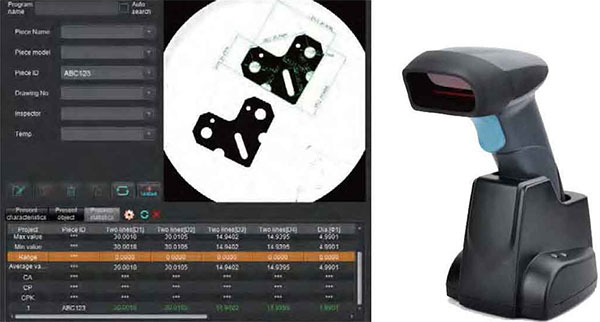
Barcode Scanner
The barcode value which is read by Scanner can be saved as inspection information, or used to search program according to definition of the operator.
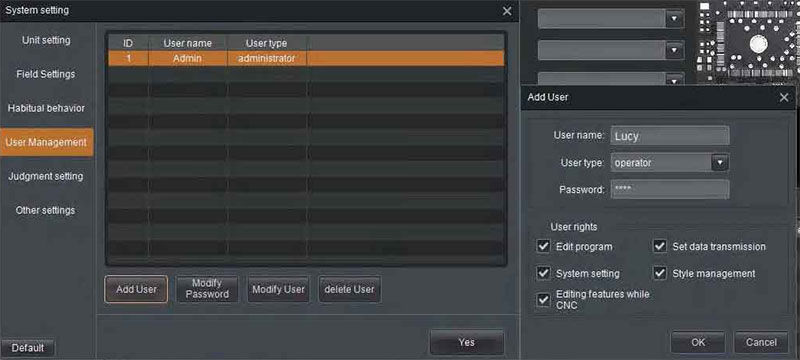
User Management
The accounts can be defined as administrator or operator, and user rights of the operator account could be constrained according to requirement.
Statisticl Analysis
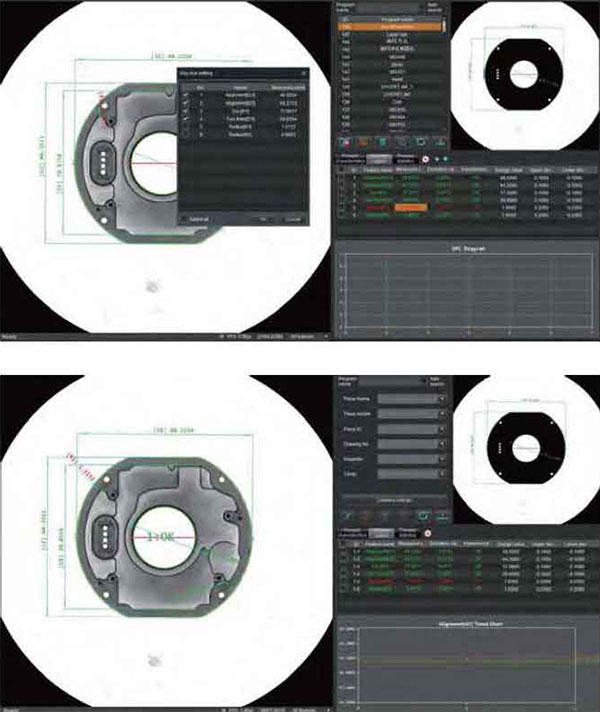
The statistical analysis interface has the tabs of [Statistical Value], [Trend Chart], [Histogram] and [Data List]
Automatic recording and sorting
Measurement results and its main statistical information (e.g. average value, ?, 3?, 6?, Ca, Cp, Cpk etc) will be automatically recorded and saved. Operator could search records by different conditions.
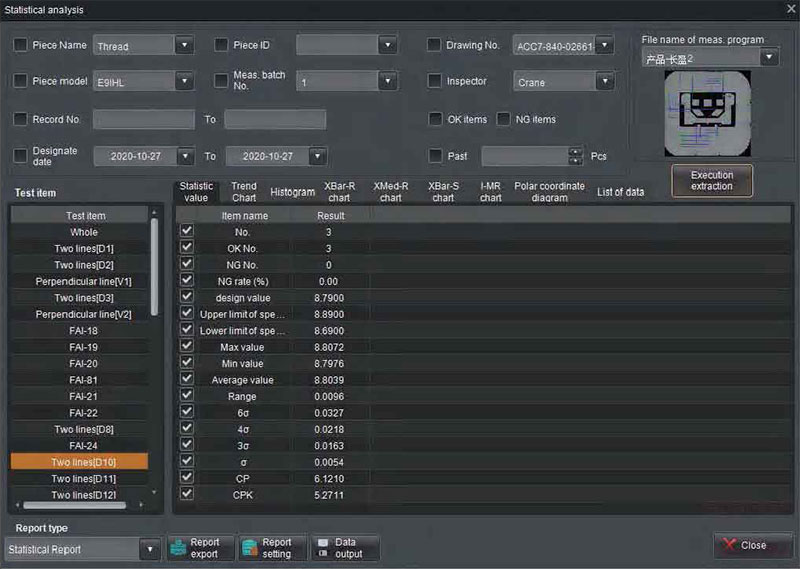
Statistic
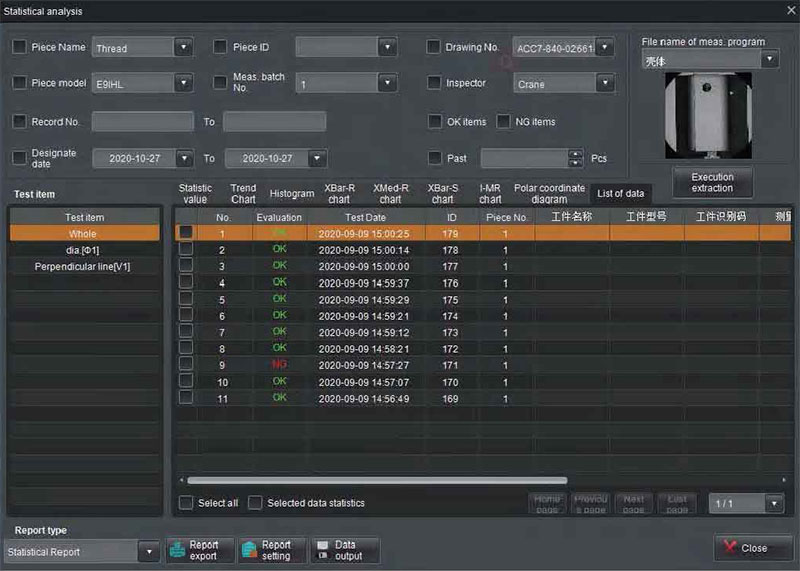
Tabled data
Control production process and improve product quality
The trend chart monitors the abnormalities of generating equipment and production process by regularly changing trend of measured values. Such as the monotonic and periodic changes of the measured values.
The histogram reflects the fluctuation and distribution of product quality, and transmits information about process quality, which can be used to judge and predict product quality and unqualified rate.
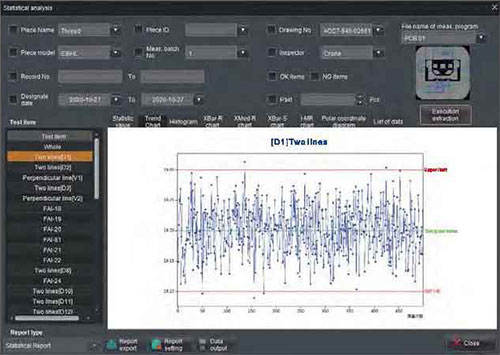
Trend Chart
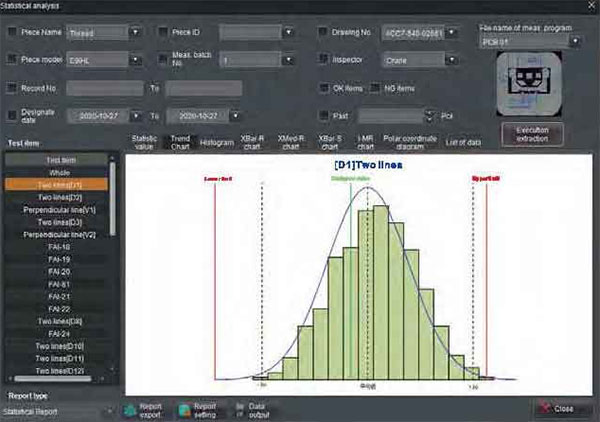
Histogram
By quality diagnosis and analysis, SPC statistical method can not only realize the monitoring of product quality, but also reflect the change trend in the generation process, reduce the waste caused by post-inspection, so as to achieve the effect of controlling the production process and improving product quality.
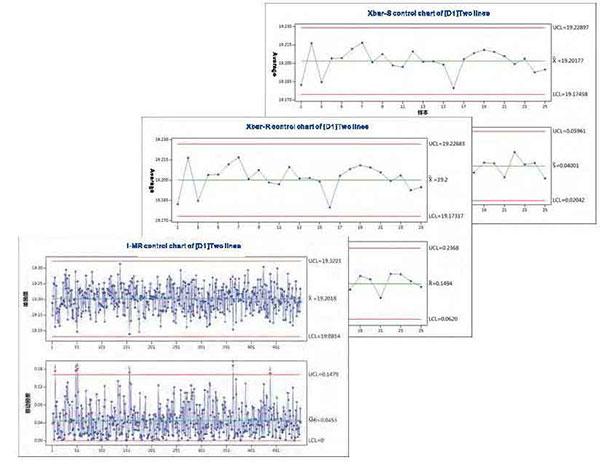
Control Charts
Generate measurement report automatically by One Key
- 1. Import and export Measurement records
- 2. Able to saved as PDF, CSV, Excel ,text files
- 3. Support user-defined PDF report template
- 4. Support user-defined Excel report template
- 5. Quick export and print reports by one key
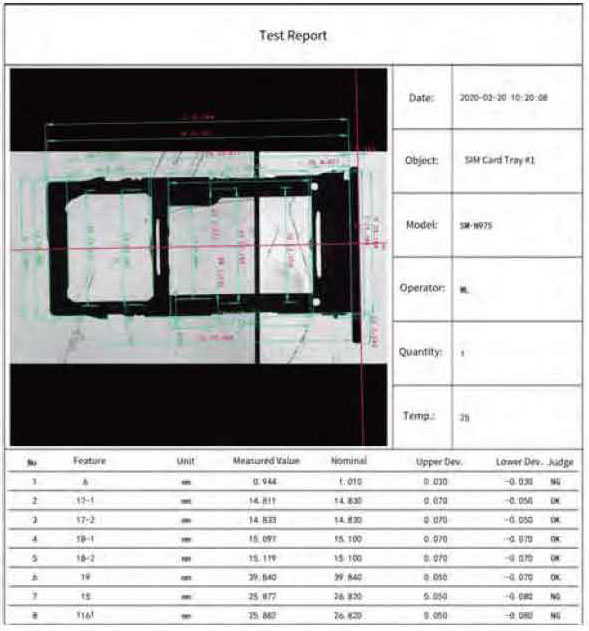
Test report
Evaluaion Methods
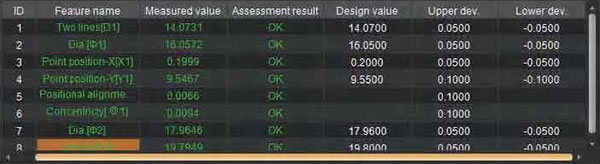
Standard Tolerance
Evaluate the measured values against the given design value and upper/lower tolerances specified on the drawing.
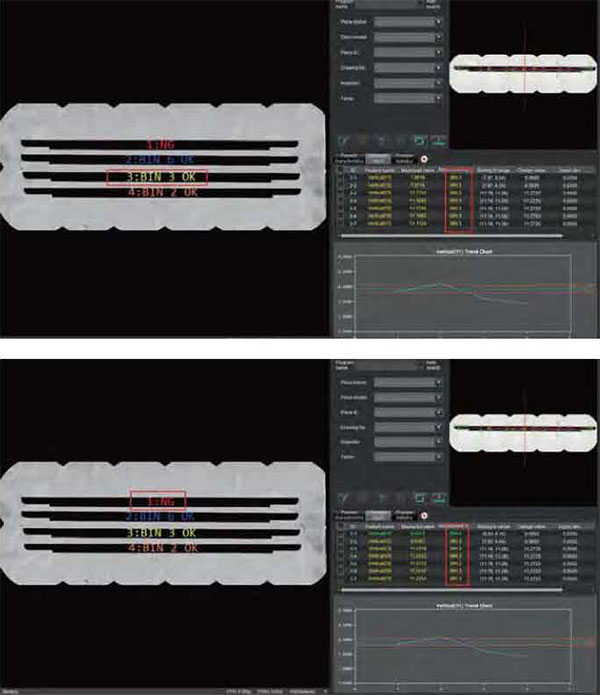
Grade of Tolerance
Divide the tolerance into multiple grades according to deviation range. Evaluate the sample's grade based on the actual measured value; If the dimensions of a sample are not in the same grade, this sample is unqualified. Classifying samples into different grades facilitates assembly and reduces waste.
Proportion of Tolerance
Divide the tolerance into multiple grades according to tolerance percentage. Evaluate the sample's grade based on the actual measured value, so it can be used for pre-warning of processing equipment`s state.
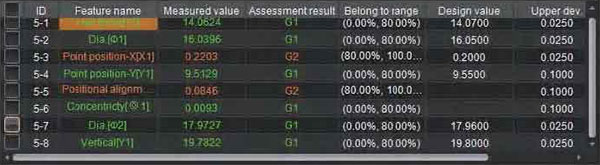
Critical Dimensions
The sample is qualified by only Critical Dimensions which are specified by the operator.
|
|
||
No technical information is currently available.
No application information is currently available.
No videos or documents are currently available.
Why Buy From MQS?
Over 40 years supplying precision measuring equipment throughout the UK and Ireland.
Expert Advice
Experienced engineers helping you select the correct measuring solution.
UKAS Calibration
Full UKAS accredited calibration laboratory with nationwide support.
Installation & Training
Installation, commissioning and operator training available.
After Sales Support
Technical support, servicing, repairs and ongoing customer care.